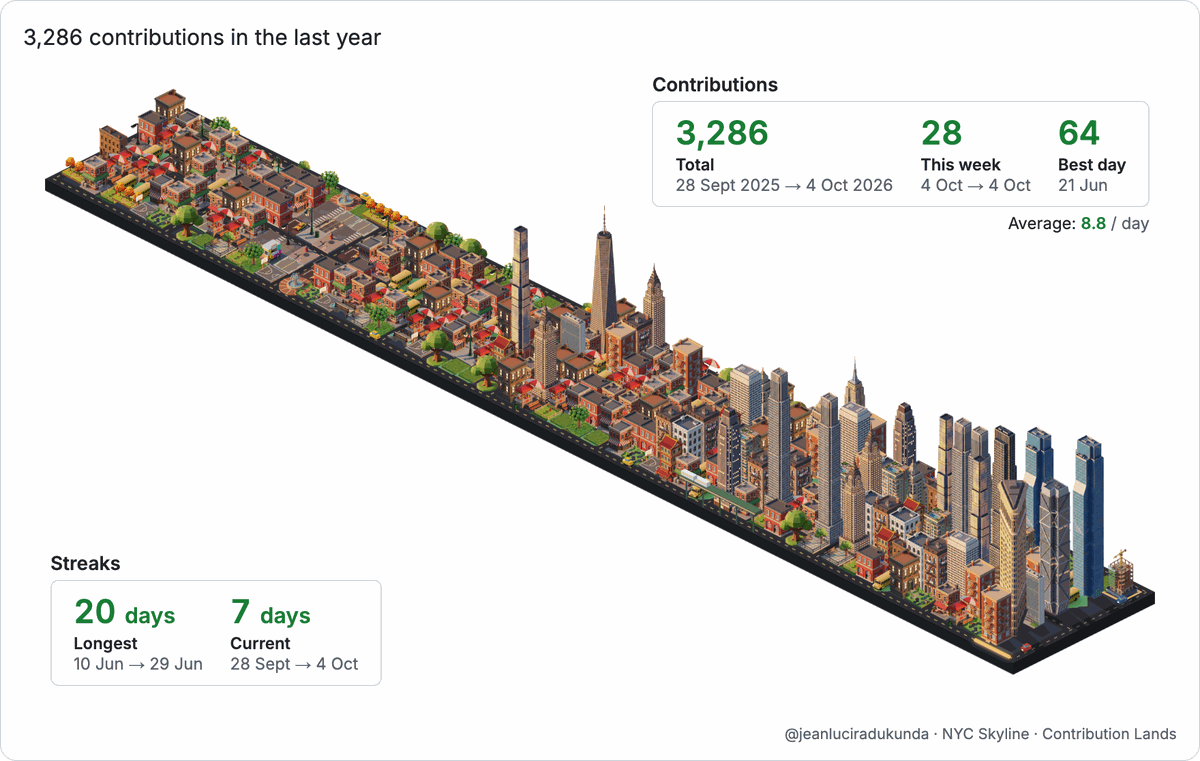
Contribution Lands is a Chrome extension that rebuilds the contribution graph on GitHub profile pages as an isometric New York City. Every day is a lot. Quiet days stay low, busy days rise into towers, and today is a building site.
Free and MIT licensed · Chrome 111 or later · On the Chrome Web Store
A-101a real year · 1 lot = 1 day
drawn by
a sample year
scale
1 lot : 1 day
span
22 weeks
sheetA-101
Move across the drawing to build it
Drawn from your contributions.
A-102historyFigure from Hairline by Lucas Marques, MIT
Each lot is one day of your contribution graph. The commits, pull requests, reviews and issues GitHub already counts for that day set its height, on one scale for everyone.
The extension reads the calendar on the profile you are viewing, and the public contributions page for earlier dates so streaks are complete. Nothing is sent anywhere else and nothing is stored but your settings. Privacy policy.
Works on any profile, yours or anyone's. The drawing above is the maker's own last 22 weeks, refreshed every night.
Every detail, by what it means.
Eight figures, shelved by where you meet them. Each one answers the pointer.
The land
3 sheets · A-201 to A-203
One scale for everyone
A-201hover a shade
A day's height comes from its count, on the same scale for everyone: 40 or more is a skyscraper whoever you are, so a steady heavy year reads as skyline.
4 topping out
3 cladding
2 frame
1 groundwork
0 nothing yet
Today is a building site
A-202stage 2 · frame
Today's lot climbs a stage each time today's shade deepens. Tomorrow it is built like any other day.
Your best days are landmarks
A-203hover the tall one
Your sixteen busiest days are built as real New York buildings, ranked from your best day down.
The sixteen, from your best day down
Empire State Building
Chrysler Building
One World Trade Center
Statue of Liberty
Flatiron Building
30 Rockefeller Plaza
One Vanderbilt
30 Hudson Yards and the Edge
56 Leonard Street
Hearst Tower
40 Wall Street
Bank of America Tower
8 Spruce Street
Central Park Tower
Woolworth Building
The Vessel
The streets
2 sheets · A-301 to A-302
Streaks run on rails
A-3019-day streak
Your longest streak is an elevated railway along the front street, with a train running its length.
Blocks, streets and taxis
A-3023 blocks · 18 weeks
Weeks are grouped into six-week blocks with streets between them, and taxis work the grid. Motion can be switched off in the popup.
On your profile
2 sheets · A-401 to A-402
Stats in GitHub's own style
hover a statA-401
Contributions and Streaks panels sit over the land, styled like GitHub's own headings.
Click a building, see that day
A-402click a building
Clicking a lot does what clicking a square does: GitHub filters the activity below to that day.
In the toolbar
1 sheet · A-501
Contribution LandsYour contribution graph, built as a world.
WorldDisplay
Changes apply instantly to open GitHub profiles.
One popup, five settings
Lands · stats on · motion onA-501
World
NYC Skyline, the one world that ships today. More worlds later.
2D, Lands, Both
Keep GitHub's squares, swap them for the city, or show the two together.
Same scale
Heights from each day's count on one scale for everyone, or GitHub's shades relative to your own busiest days.
Stats
Show or hide the Contributions and Streaks panels.
Motion
Taxis and the train move, or the city holds still.
Light and dark follow your GitHub theme.
In your README
1 sheet · A-601
A-601 A real render from the Action, light version.
Your city, rendered every night
.webp · light and dark
Add this workflow to your profile repository, the one named after your username.
Run it once from the Actions tab. It then renders nightly.
Show images/contribution-land-light.webp in your README, with contribution-land-dark.webp in a <picture> source for dark mode.